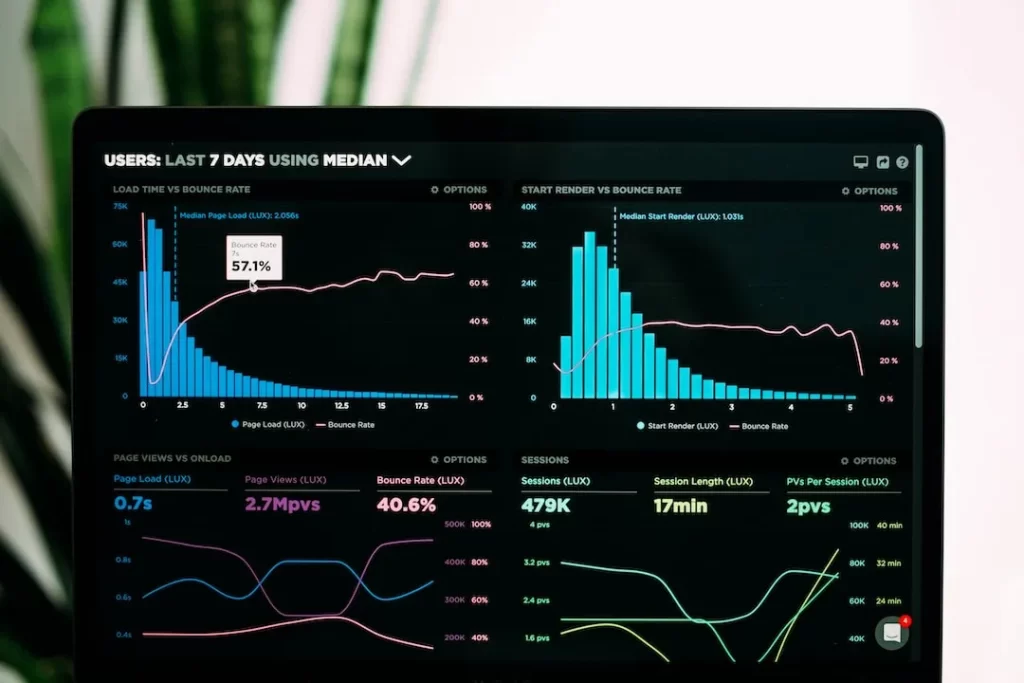
In the realm of data analysis, technological advancements have brought about tools and strategies that were unimaginable decades ago. The ability to sift through vast amounts of data and extract meaningful insights is now at the fingertips of researchers, analysts, and even business owners. One of these revolutionary tools is the bar chart. Used across a broad spectrum of fields, bar charts provide a visually appealing and efficient way to represent data and identify important trends and patterns. Keep reading to discover how data analysis can be simplified with bar charts.
Understanding the Basics of Bar Charts

A bar chart is a graphical representation of data that uses rectangular bars of varying heights or lengths to represent values. The bars can be plotted either vertically or horizontally. The lengths or heights of the bars correspond to the quantity of the variable or category they represent.
Each bar in a bar chart represents a category. In a vertical bar chart, the height of the bar signifies the value of the category it represents. Conversely, in a horizontal bar chart, the length of the bar illustrates the value of the category. Regardless of the orientation, the visual comparison of the bars enables the viewer to make easy comparisons between different categories.
One of the key advantages of bar charts is their easy readability and comprehensibility. Unlike other data representation tools, bar charts do not require advanced knowledge or complex interpretation. They are straightforward and provide immediate visual clues about patterns, trends, and contrasts in the data. These characteristics make bar charts an extremely popular tool for data analysis and representation across numerous fields.
The Role of Bar Charts in Data Analysis

Bar charts play an essential role in data analysis. They help to display and compare the amount, frequency, or other measure (such as mean) for different categories or groups of data. What distinguishes bar charts from other data visualization tools is their ability to handle various types of data, including nominal data (such as names, ethnicities, or titles), ordinal data (like ranks or scales), or scalar data (such as numbers or quantities).
In addition to representing different data types, bar charts also enable the display of multiple data series. This allows researchers or analysts to compare and analyze the relationships between different data series. For example, a business analyst working on market trends might use a bar chart to compare the sales data of multiple products across different time periods. This comparison would help identify patterns and trends that could drive strategic decisions.
Bar charts can also help analyze trends over time, especially when the data is represented in a stacked bar chart. This form of bar chart allows for part-to-whole comparisons over time or across different categories. These insights can be invaluable in various scenarios, whether you’re tracking a project’s progress, analyzing sales figures, or conducting scientific research。
The Impact of Bar Charts on Decision-Making
Bar charts provide significant value in the data-driven decision-making process. As visual tools, they help present complex data sets in an easily digestible format, allowing decision-makers to understand the information and derive insights quickly. They help highlight trends, patterns, and outliers data, serving as a springboard for deeper investigation.
Furthermore, by representing the data visually, bar charts facilitate comparison, making it easier to understand the relationships between different categories or data series. This aids decision-makers in identifying opportunities, risks, and areas for improvement. For instance, a business might use a bar chart to compare the performance of different products or services, guiding its resource allocation strategies.
Last but not least, bar charts can also help communicate findings to others, particularly those who are not familiar with the data or the topic. They are a great tool for presentations and reports, making complex data understandable to a wider audience. This makes bar charts not only a valuable tool for data analysts and researchers but also for managers, stakeholders, and anyone involved in decision-making processes.
Overall, whether you’re a seasoned data analyst, a manager looking to make informed decisions, or a layperson seeking to understand the world through data, the bar chart offers an accessible and efficient tool for making sense of the data-filled world around us.


